Navigation:
Gnuplot for Mac OS X 6.0.1 freeware
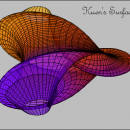
... by the gnuplot Team, is a powerful, versatile plotting utility that excels in generating 2D and 3D graphs. Ideal for scientists, engineers, and data analysts, it supports a wide range of output ... making it an invaluable tool for visualizing complex data sets with clarity and precision. ...
| Author | gnuplot Team |
| Released | 2024-09-29 |
| Filesize | 41.60 MB |
| Downloads | 954 |
| OS | Windows 11, Windows 10 32/64 bit, Windows 8 32/64 bit, Windows 7 32/64 bit |
| Installation | Instal And Uninstall |
| Keywords | gnuplot, graph plotter, plot graph, plotter, plot, graph, function |
| Users' rating (29 rating) |
Gnuplot for Mac OS X Free Download - we do not host any Gnuplot for Mac OS X torrent files or links of Gnuplot for Mac OS X on rapidshare.com, depositfiles.com, megaupload.com etc. All Gnuplot for Mac OS X download links are direct Gnuplot for Mac OS X download from publisher site or their selected mirrors.
| 6.0.1 | Sep 29, 2024 | New Release | CHANGE: Use of data source '-' inside a multiplot is an error; use a local datablock instead Gd: scale "dot" (pointtype 0) by current linewidth Modify configure script to accommodate Fedora dependencies FIX: Empty field in csv file should not generate a tic label Do not autoscale or extend axis ranges while zooming X11: Empirical correction for bad rotation of enhanced text Wxt: Add exception handler for mouse event processing Wxt: make right-mouse zoom box independent of terminal scaling Regression: border color of objects with fillstyle "empty" "set colorbox border {<lt>}" parsing error Svg: set default fill properties for depth-sorted pm3d objects Gd x11: very short arrows were not drawn at all "stats ... name FOO" Do not delete existing variables FOO_* Order-dependent parsing of 2D plots with "fs solid fc variable" Mp: configure --with-metapost failed to include mp terminal Qt wxt x11: "set term" from a script causes next pause to fail Tikz: fix use of palettes with a fixed number of colors |
| 5.4.10 / 6.1 | Jul 15, 2024 | New Release | Fix: Postscript: build failed in 5.4.9 if neither gd nor cairo libraries present Data-dependent variable point properties in polar plots <li class="bbli">Change: Use 64-bit integers for iteration (allows iteration over dates) |
| 5.2.7 | May 29, 2019 | New Release | NEW "set pm3d noclipcb" will skip drawing quadrangles with color < cbmin * NEW pm terminal supports utf8, dashed lines, bold/italic text * NEW imaginary component of array values is available to "using" in column 3 * NEW gnuplot --slow may help use of qt terminal with slow system font server * CHANGE splot "with points pt 0" acts like "with dots" * CHANGE (tikz) improved default interpretation of gnuplot arrowhead style * CHANGE teach hidden3d to handle double-headed vectors (arrowstyle "heads") * CHANGE "unset title" or "reset" resets all title properties to default * CHANGE font names passed to enhanced text processing may be in quotes * CHANGE cairo terminals accept fractional font sizes * CHANGE "plot with table" does not output trailing field separator * CHANGE better centering for clustered histograms * CHANGE clear STATS_* variables before performing analysis * CHANGE cairo, libgd, and svg terminals handle LT_NODRAW by not drawing at all |